Plot 2D Effects
plot2d.RdFunction to plot simple 2D graphics for univariate effects/functions.
plot2d(x, residuals = FALSE, rug = FALSE, jitter = TRUE,
  col.residuals = NULL, col.lines = NULL, col.polygons = NULL,
  col.rug = NULL, c.select = NULL, fill.select = NULL,
  data = NULL, sep = "", month = NULL, year = NULL,
  step = 12, shift = NULL, trans = NULL,
  scheme = 2, s2.col = NULL, grid = 50, ...)
Arguments
- x
A matrix or data frame, containing the covariate for which the effect should be plotted in the first column and at least a second column containing the effect. Another possibility is to specify the plot via a
formula, e.g.y ~ x, see the examples.xmay also be a character file path to the data to be used for plotting.- residuals
If set to
TRUE, residuals may also be plotted if available. Residuals must be supplied as anattribute named"residuals", which is a matrix or data frame where the first column is the covariate and the second column the residuals.- rug
Add a
rugto the plot.- jitter
- col.residuals
The color of the partial residuals.
- col.lines
The color of the lines.
- col.polygons
Specify the background color of polygons, if
xhas at least 3 columns, i.e. column 2 and 3 can form one polygon.- col.rug
Specify the color of the rug representation.
- c.select
Integer vector of maximum length of columns of
x, selects the columns of the resulting data matrix that should be used for plotting. E.g. ifxhas 5 columns, thenc.select = c(1, 2, 5)will select column 1, 2 and 5 for plotting. Note that first element ofc.selectshould always be the column that holds the variable for the x-axis.- fill.select
Integer vector, select pairwise the columns of the resulting data matrix that should form one polygon with a certain background color specified in argument
col. E.g.xhas three columns, or is specified with formulaf1 + f2 ~ x, then settingfill.select = c(0, 1, 1)will draw a polygon withf1andf2as boundaries. Ifxhas five columns or the formula is e.g.f1 + f2 + f3 + f4 ~ x, then settingfill.select = c(0, 1, 1, 2, 2), the pairsf1,f2andf3,f4are selected to form two polygons.- data
If
xis a formula, adata.frameorlist. By default the variables are taken fromenvironment(x): typically the environment from whichplot2dis called. Note thatdatamay also be a character file path to the data.- sep
The field separator character when
xordatais a character, see functionread.table.- month, year, step
Provide specific annotation for plotting estimation results for temporal variables.
monthandyeardefine the minimum time point whereas step specifies the type of temporal data withstep = 4,step = 2andstep = 1corresponding to quarterly, half yearly and yearly data.- shift
Numeric constant to be added to the smooth before plotting.
- trans
Function to be applied to the smooth before plotting, e.g., to transform the plot to the response scale.
- scheme
Sets the plotting scheme for polygons, possible values are
1and2.- s2.col
The color for the second plotting scheme.
- grid
Integer, specifies the number of polygons for the second plotting scheme.
- ...
Other graphical parameters, please see the details.
Details
For 2D plots the following graphical parameters may be specified additionally:
cex: Specify the size of partial residuals,lty: The line type for each column that is plotted, e.g.lty = c(1, 2),lwd: The line width for each column that is plotted, e.g.lwd = c(1, 2),poly.lty: The line type to be used for the polygons,poly.lwd: The line width to be used for the polygons,densityangle,border: Seepolygon,...: Other graphical parameters, see functionplot.
Examples
## Generate some data.
set.seed(111)
n <- 500
## Regressor.
d <- data.frame(x = runif(n, -3, 3))

## Response.
d$y <- with(d, 10 + sin(x) + rnorm(n, sd = 0.6))

if (FALSE) ## Estimate model.
b <- bamlss(y ~ s(x), data = d)
summary(b)
#> Error in eval(expr, envir, enclos): object 'b' not found

## Plot estimated effect.
plot(b)
#> Error in h(simpleError(msg, call)): error in evaluating the argument 'x' in selecting a method for function 'plot': object 'b' not found
plot(b, rug = FALSE)
#> Error in h(simpleError(msg, call)): error in evaluating the argument 'x' in selecting a method for function 'plot': object 'b' not found

## Extract fitted values.
f <- fitted(b, model = "mu", term = "s(x)")
#> Error in eval(expr, envir, enclos): object 'b' not found
f <- cbind(d["x"], f)
#> Error in eval(expr, envir, enclos): object 'f' not found

## Now use plot2d.
plot2d(f)
#> Error in eval(expr, envir, enclos): object 'f' not found
plot2d(f, fill.select = c(0, 1, 0, 1))
#> Error in eval(expr, envir, enclos): object 'f' not found
plot2d(f, fill.select = c(0, 1, 0, 1), lty = c(2, 1, 2))
#> Error in eval(expr, envir, enclos): object 'f' not found
plot2d(f, fill.select = c(0, 1, 0, 1), lty = c(2, 1, 2),
  scheme = 2)
#> Error in eval(expr, envir, enclos): object 'f' not found

## Variations.
plot2d(sin(x) ~ x, data = d)
d$f <- with(d, sin(d$x))
plot2d(f ~ x, data = d)

d$f1 <- with(d, f + 0.1)
d$f2 <- with(d, f - 0.1)
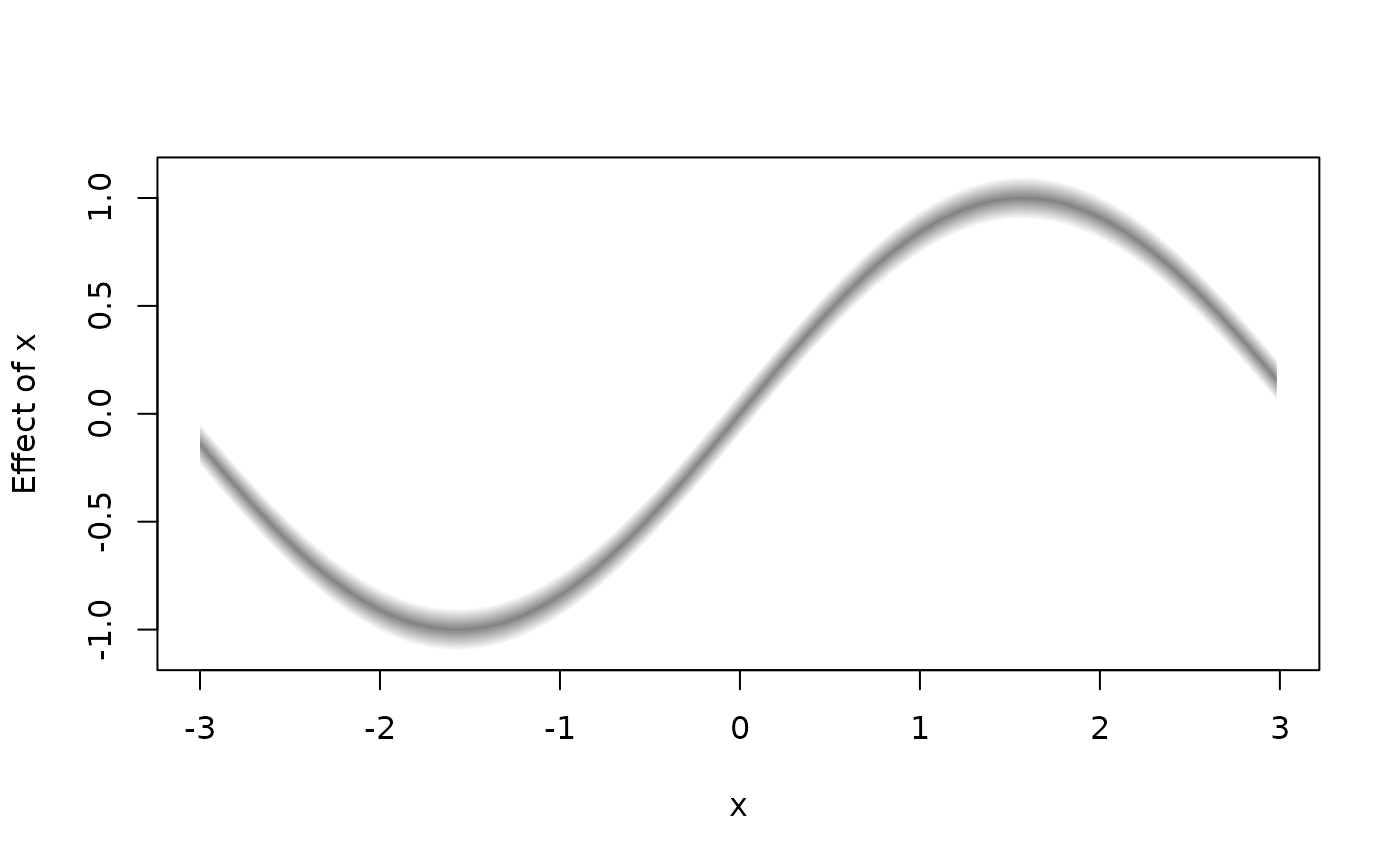
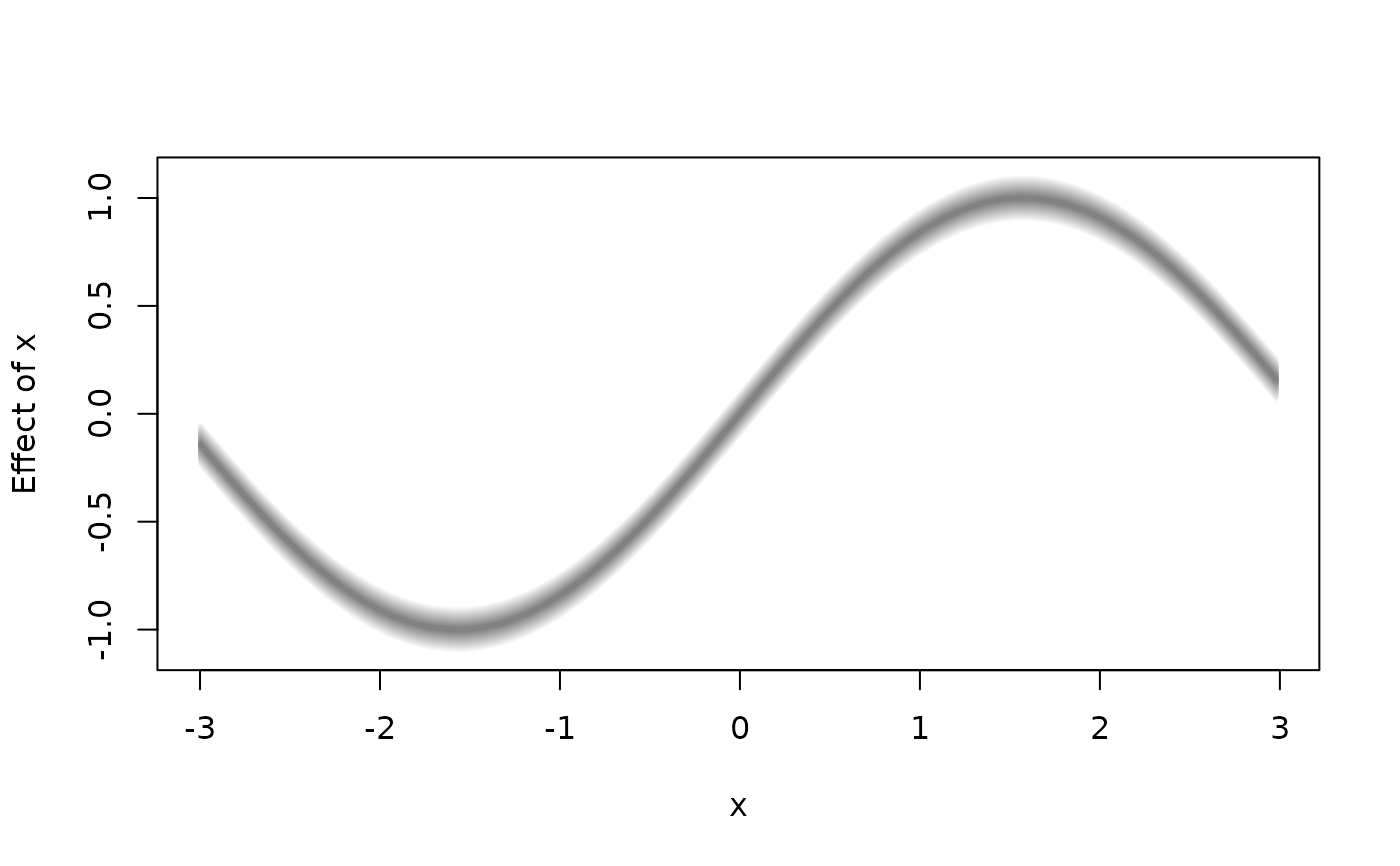
plot2d(f1 + f2 ~ x, data = d)

plot2d(f1 + f2 ~ x, data = d, fill.select = c(0, 1, 1), lty = 0)

plot2d(f1 + f2 ~ x, data = d, fill.select = c(0, 1, 1), lty = 0,
  density = 20, poly.lty = 1, poly.lwd = 2)

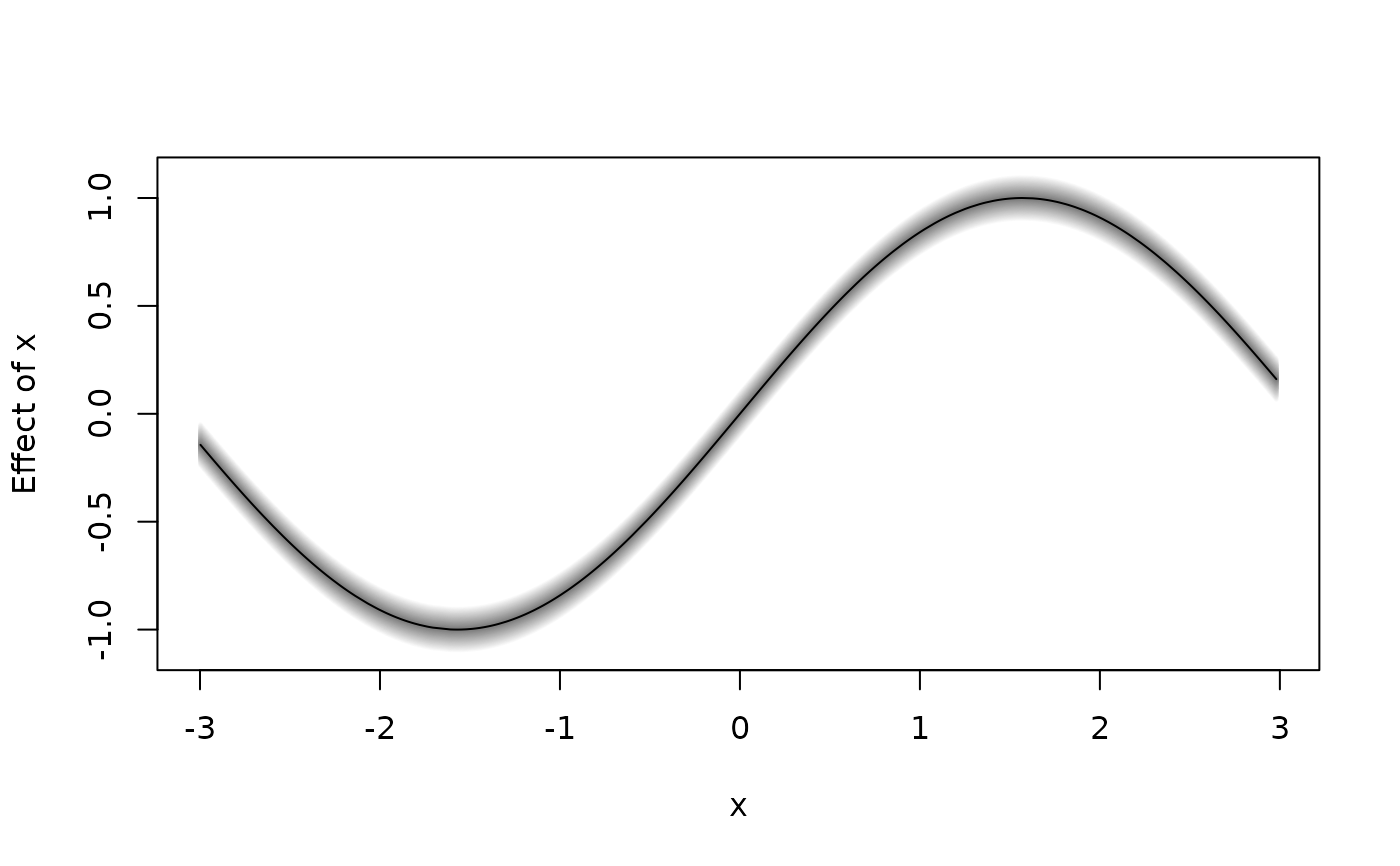
plot2d(f1 + f + f2 ~ x, data = d, fill.select = c(0, 1, 0, 1),
  lty = c(0, 1, 0), density = 20, poly.lty = 1, poly.lwd = 2)
